


The two pie charts below show the percentages of industry sectors’ contribution to the economy of Turkey in 2000 and 2016.
Sample Answer of Contribution to the Economy of Turkey in 2000 and 2016
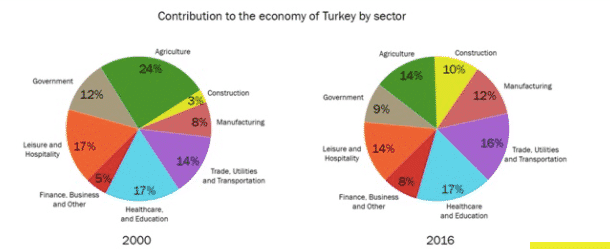
The couple of pie charts manifest the information regarding the contribution of distinct areas to the Turkish economy between 2000 and 2016.
Overall, the most striking feature is that the agriculture sector contributed the highest ratio of the economy of Turkey and construction was the least economic sector in it. In contrast, at the end of the period healthcare and education became the largest economic sector and the lowest contribution was made by financial, business, and other services.
As is presented in the pie charts, in 2000, agriculture made the largest contribution to the Turkish regarding the economy, almost a quarter. However, this figure was plummeted to just 14%, by 2016. The leisure, hospitality, and government sector’s investment economy ratio declined. The former went down from 17% to 14% and latter decreased from 12% to 9%. Interestingly, the contribution of healthcare and education had remained unchanged at 17%, throughout both given tenure. With regard to trade, utilities, and transport, which had a minor decrease from 16% to 14%, for contributions in the economy. In the case of construction services, the minority of contributions had had just like 3%, in 2000, whereas, it was increased threefold as compared to the first time period. Initially, merely 8% contribution was done by the manufacturing department and then it was inclined about 12% in 2016. Finance, business, and other service’s contribution were risen from 5% to 8%, in 2016.
Also, Read population figures for different types of turtles in India