


The pie graphs show the nutritional consistency of the two dinners. Write a report to a university lecturer describing the data. Summarise the information by selecting and reporting the main features, and make comparisons where relevant. Write at least 150 words.

The pie graphs show the nutritional consistency of the two dinners. Write a report to a university lecturer describing the data. Write at least 150 words.
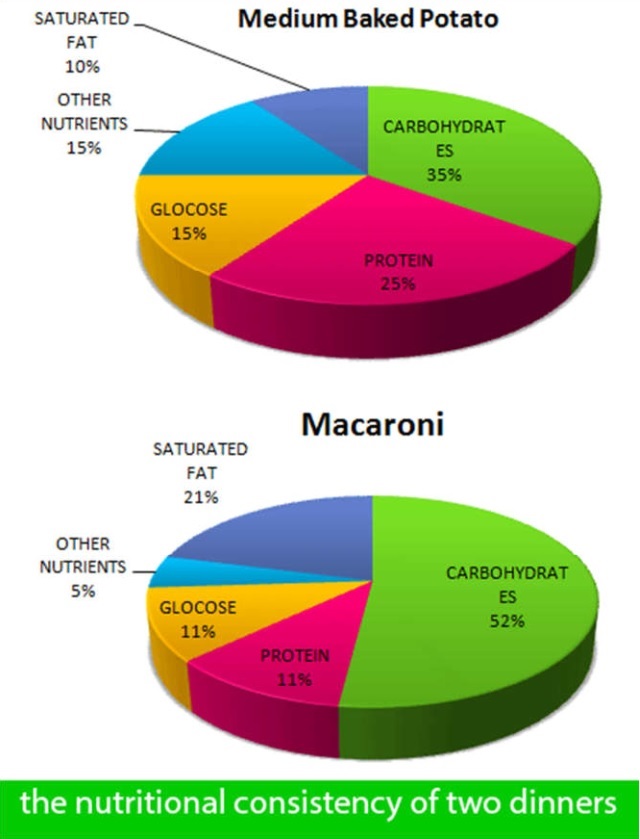
The two pie charts illustrate the consistency of different nutrients in two suppers (medium baked potato and macaroni).
Overall, it can be seen that macaroni has a larger amount of carbohydrates than a baked potato. However, other nutrients and saturated fat are reported as lower per cent in two items.
It is interesting to note in the pictorial split that macaroni has more than half of carbohydrates (52%) than the average-sized baked potato (35%). The proportion of proteins is higher (25%) than the second dinner, which has only 11%. The quantity of glucose in the first supper potato is 15%, while the macaroni accounted for 11%. The per cent of glucose and proteins are the same in the second item.
Although the percentage of saturated fat in macaroni is just 21%, it is a mere 10% in the baked potato. The amount of other Nutrients is stated as 15% in the first dinner whereas, in the macaroni, it is negligible (5%).
Follow Us on Facebook