


The bar chart below shows the numbers of men and women attending various evening courses at an adult education centre in the year 2009. The pie chart gives information about the ages of these course participants. Summarize the information by selecting and reporting the main features, and make comparisons where relevant.

Sample Answer of The Bar Chart Below Shows the Numbers of Men and Women Attending Various Evening Courses
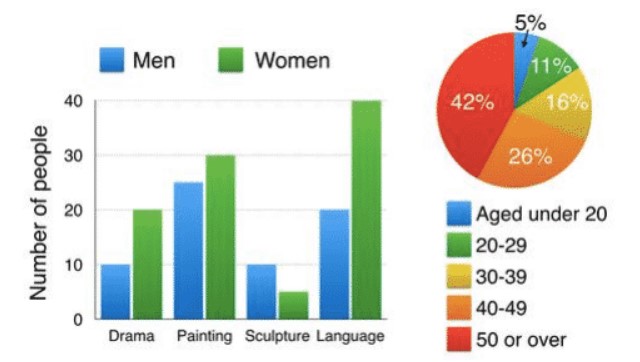
The vertical bar graph elucidates the count of males and females who joined evening classes at a centre of adult education in 2009. At the same time, the pie chart provides the data about the age of candidates who opted for those courses.
It is vivid, the maximum number of ladies with the count of 40 jointed language subject. However, less than ten females chose sculpture courses to study. Moving further, the subject preferred by the highest numeral of men was painting, and the count of gentlemen was about 25. While a similar number of males(10) joined drama and sculpture for the evening study, and it witnessed the minimum count.
Moving towards the pie chart, teenagers were witnessed to attend those courses with the least percentile of 5. Contrastingly, the highest proportion of students were observed above the age of 50. The percentage of adults of age 20-29 and 30-39 was found similar(11% and 16% respectively).
All in all, most of the females preferred language subjects. While painting was chosen by men the most and the maximum number of students, who joined classes after noontime, were adults.