


The Bar Chart Shows the Monthly Spending in Dollars of A Family in The USA on Three Items in 2010.
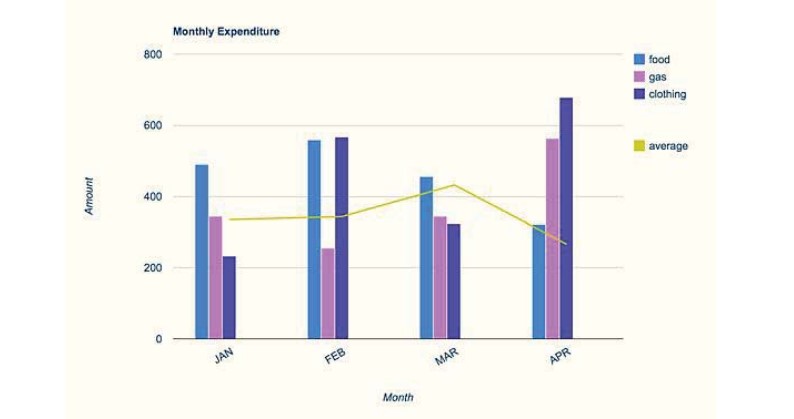

Overall, it is manifest from the graph that the most money was spent on clothing by US families, while the least amount was spent on gas.
To begin with, in January, families in the USA spent almost 500 dollars on food. Monthly expenditure on gas by US families was below 400 US dollars, while the amount spent on clothing was about 220 dollars. In addition, the monthly expenditure on food and clothing by US families in February was approximately 550 dollars each. Meanwhile, half of that money was spent on gas.
Apart from this, people spent money on food and gas, which was 450 dollars and 370 dollars, respectively. On gas facilities, the USA people spent almost 360 dollars. Moreover, in April, the highest monthly expenditure was on clothing, followed by gas and clothing, which were the second and third highest, respectively.
However, the average money spent on the three items showed an increasing trend until March, after which this amount showed a drastic decline in April.
Follow Us on the IELTSFever Facebook Page For More Updates