


The chart and graph below give information about sales and share prices for Coca-Cola. Summaries the information by selecting and reporting the main features and making comparisons where relevant.
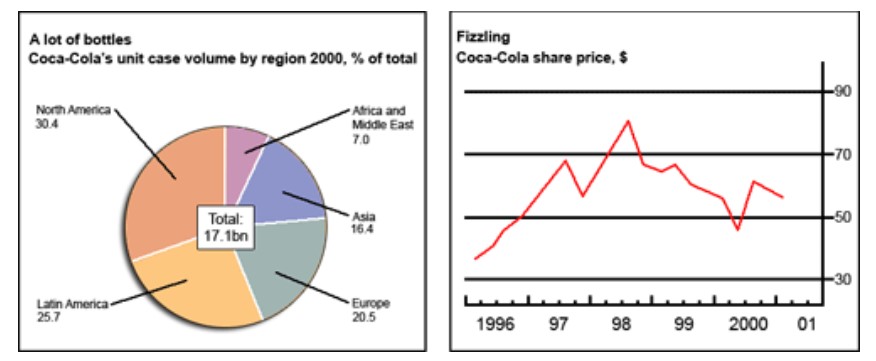

The render pie chart demonstrates the percentage of Coco-cola sales in five regions in 2000 while line graph illustrates share price from 1996 to 2001 which data was measured in $.
Overall, it can be clearly seen that the majority of sales were in the American continent whereas least in Africa and the Middle East. Additionally, throughout the time, Coco-cola share value was rose.
For sales, the third proportion of Coco-cola’s unit case was sold in North America, which was roughly double than it was in Asia. In Africa and the Middle East sales was the lowest on account of 7%. Moreover, unit case sales in Latin America and in Europe was likely a quarter and one in the tenth percentage respectively.
In 1996, Coco-cola share price was $35, which became double in mid-1997 although, it later declined slightly. In 1998, it grew again and touched a peak on account of $80. Furthermore, from mid-1998 to mid-2000, it shrank by $25. There was a sharp increasement later, at the end of 2000, the share value was $53.
Follow Us on IELTSFever Facebook