


The chart below shows global sales of the top five mobile phone brands between 2009 and 2013. Summarize the information by selecting and reporting the main features, and make comparisons where relevant.
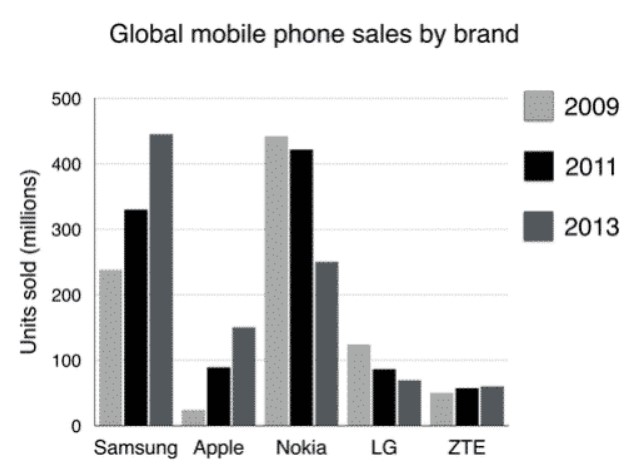

The bar graph illustrates the sales of different mobile phone brands globally from the year 2009 to 2013.
In the year 2009, a mobile company Nokia led the market and sold nearly 440 million units whereas Apple brand is at least (nearly 20 million units), however, Samsung was the second-highest brand sold nearly 240 million mobile but LG, and ZTE is not doing well and sold only 110 and 40 million sets respectively. After two years (in 2011), Nokia still be at the top but slightly lower than previous (nearly 420 units), but Samsung took a good hike and reached 320 million units; however, Apple also did well and reached similar to LG about 80 million each but ZTE at least with 50 million only.
Lastly, in the year 2013, Samsung took a significant change in sales and reached on top with the sale of 450 million units while the sale of Nokia got decline drastically by 50% and reached 220 million. However, Apple continuously increased and reached nearly 150 million. Although sales of LG declined frequently and reached 60 million, there is not much change in the sales of ZTE and stuck at 60 million.
Overall, over the span of 4 years, sales of apple increase dramatically, whereas ZTE remains almost similar throughout the years.
Follow Us on IELTSFever Facebook