


The chart below shows the expenditure on three categories among different age groups of residents in the UK in 2004. Summarise the information by selecting and reporting the main features, and make comparisons where relevant. Write at least 150 words.
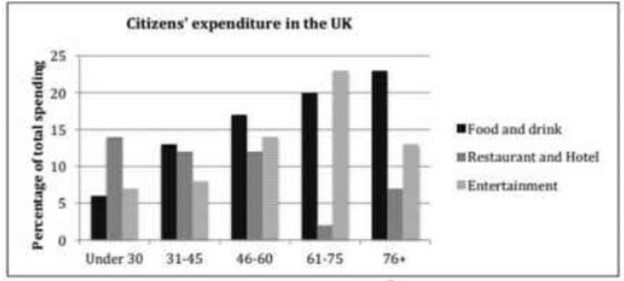

The bar chart depicts the money utilized on Food and Drink, Restaurant and Hotel and Entertainment between diverse age groups of dwellers in Britain in a year.
People less than the age of 30 more liked to spend their money on visiting Restaurant and Hotel whereas, age group of 31-45 and 46-60 expended their money almost 12 per cent which was negligence less than the age group of under 30. Spending money on food and drinks was increased with the increasing age group. Individuals between 61-75 age do not like to spend their cash on restaurants and Hotels. However, they spent almost 23percent and 20 per cent on Entertainment and Food and drinks respectively.
With the increasing of age, Britishers spent their hard cash on Entertainment which was having negligence difference between money spent on Food and Drink in every age group. In the last two age groups, denizens love to spend their cash in some proportion on Entertainment and Food and drink, which was around 23 per cent.
Overall, In the age of 61-75 people does not spend their money on Restaurant and Hotels whereas, the same age group was noticed to spend their cash on Food and drink and Entertainment which has a slight difference.
Follow Us on IELTSFever Facebook
Also read: The Chart Below Shows the Internet Users (in Millions) in Different Countries