

The Graph Below Shows the Proportion of The Population Aged 65 and Over Between 1940 and 2040 in Three Different Countries. Summarise the Information by Selecting and Reporting the Main Features, and Make Comparisons Where Relevant.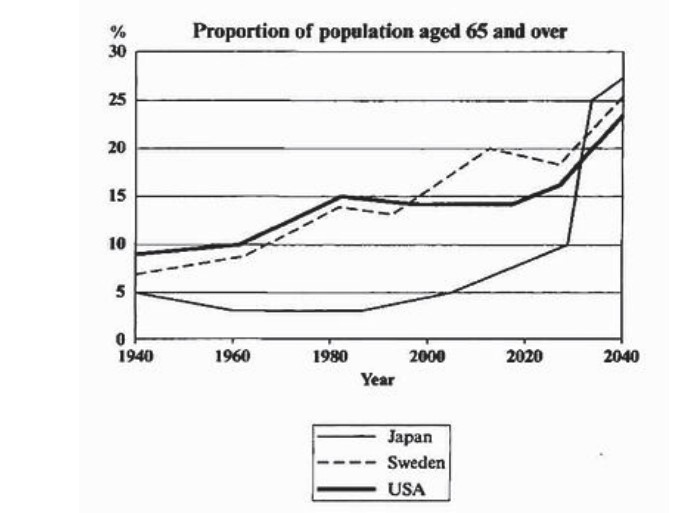
Overall, the USA and Sweden experienced an upward trend from 1940 to 1980, where the trend started to show a steady movement until 2000 for Sweden and 2020 for the USA. From 2000, the graph again clearly illustrates a sharp rise for Sweden, stopping around 2015 before dropping gradually until around 2024 and finally picking up steadily to 2040. For the USA, from 2020, the line graph flattens before rising sharply to 2040.

Lastly, Japan showed a downward trend from 1940 to 1960. From that year, the trend moved constantly up to around 1989 before rising steadily and eventually picking up top speed from 2025 to 2040.
At the beginning of the period, the USA’s population of people aged 65 was approximately 9%. It rose to 10% by around 1965, with the trend still rising in 1980, showing an increase of 5%. It remained relatively at around 14% up to around 2018 before rising sharply to 24% by the end of the period in 2040.
In Sweden, from 1940, the percentage of people aged 65 was relatively lower than that of the USA, at around 7%. The trend again depicts an upward rise all the way to 1980, with about 13%, before dropping gradually to about 12% around 1995.
From there, the graph showed an intense rise to 20% in 2015 before steadily dropping to about 18% around 2025. From there, it shoots up sharply to about 21% by the end of 2040.
Lastly, comparing Japan with Sweden and the USA, its population starts at 5%. Trends illustrate a gradual decrease of about 2% in 1960 before moving constantly all the way to around 1989. The trend began to rise, and by around 2008, it had returned to 5%. The trend kept rising to 10%, and by the end of the period, it had reached approximately 27%.
Follow Us on the IELTSFever Facebook Page For More Updates