


The graph shows a comparison in the pulse rate changes between two different individuals of different ages and professions. Write a report for a university tutor describing the information shown in the diagrams below.
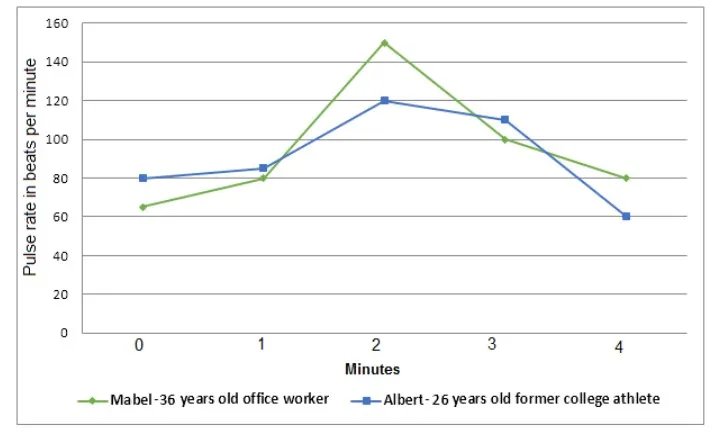

The graph compares pulse rate differences between Mabel, a 36 years old office worker and Albert, a 26 years old former college athlete measured in beats per minute.
Overall, Albert recorded the highest pulse in the beginning, whiles Mabel’s pulse became the greatest at the end of the period.
At the beginning of the period, Alberts pulse was 80 beats per minute and had steady growth until it reached almost 90 beats per minute in the first minute. There was a sharp rise to 120 beats per minute in the second minute and then dropped to around 120 beats per minute. It continued to decline till the end of the period experiencing the lowest point at 60 beats per minute.
At zero minutes, Mabel’s pulse stayed around 70 beats per minute and saw a rise to 80 beats per minute in the first minute. There was a swift inclination to almost 150 beats per minute in the second minute before dropping sharply to 100 in the third minute. It continued to go down till the end of the season, reaching 80 beats per minute and outracing Albert’s pulse at the end of the period.
Follow Us on IELTSFever Facebook