


The Table Below Gives Information on Consumer Spending on Different Items in Five Different Countries in 2002. Summarise the Information by Selecting and Reporting the Main Features, and Make Comparisons Where Relevant.

The tabular chart delineates the percentage of five national shoppers who spent their money on several modules in the year 2002.
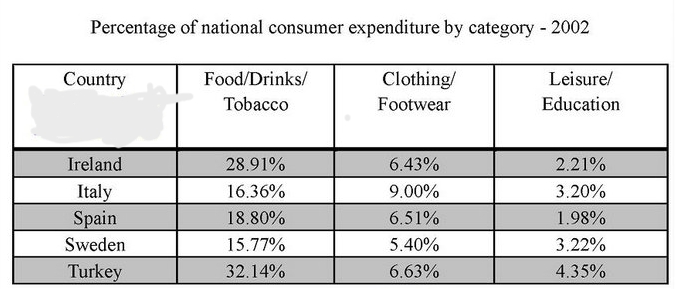
Overall, it is immediately apparent from the chart purchasers from Turkey and Ireland remained at a higher consumption of food, drinks, and tobacco. However, this pattern was reversed in Sweden.
Also, Read The Table Below Shows the Figures for Imprisonment in Five Countries Between 1930 and 1980
To begin with, the total consumption of food, drink and tobacco grew steadily and strongly to finally reach 32.14% in Turkey, but consumers had less interest in clothing, footwear and leisure/ education, with shares at 6.63% and 4.35%, respectively in 2002.
Moving on to another country, the second highest consumption of food, drinks and tobacco by customers accounted for 28.91% in Ireland, but they spent a nominal on the clothing and footwear section with shares at 6.43%, and this number declined in the education sector at to 2.21% in 2002.
Furthermore, education and the sector had similar expenditure values by the users nearby, at 3.2% for both Italy and Spain. Meanwhile, in Italy, people consume 16.36% of their food, drinks, and tobacco, and 9.0% of the money is spent on clothing and footwear.
It is interesting to note that the clothing and footwear module was less popular in Spain and Sweden. Only 6.5% and 5.40% of buyers used their money on it. Meanwhile, the depletion of food, drinks and tobacco in Spain was 18.18.1%, and this share plummeted by 3% in Sweden.
Follow Us on the IELTSFever Facebook Page For More Updates