


The table below illustrates weekly consumption by age group of dairy products in a European country. Summarise the information by selecting and reporting the main features, and make comparisons where relevant.

Sample Answer of The Table Below Illustrates Weekly Consumption by Age Group of Dairy Products
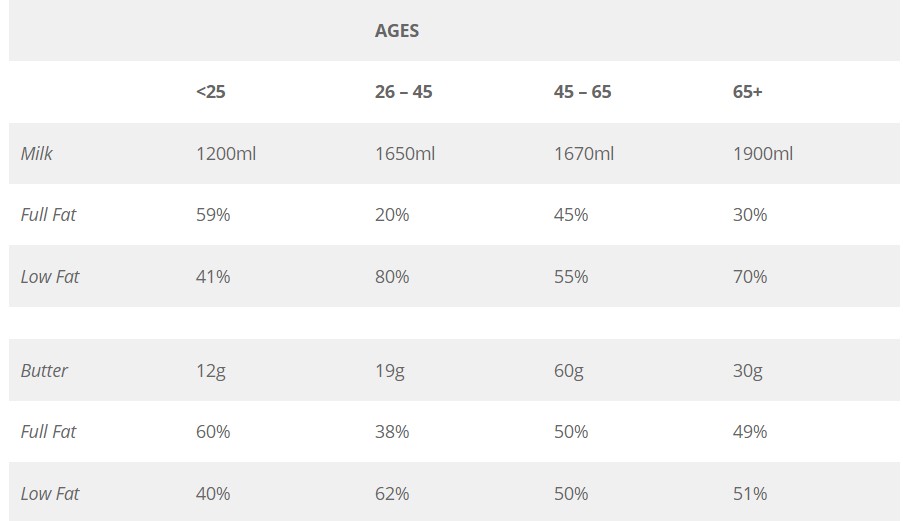
The tabular chart gives information about seven days’ consumption in four different age groups and six various daily products in the European nation.
In the case of milk consumption, the highest amount of milk is consumed by aged people who are 65 plus. At the same time, the less milk contains by young masses, which is 1900 ml and 1200 ml respectively. Further, the maximum use of full-fat products is by the young generation. Who is outstripping the other three age groups? Furthermore, low-fat items are used by age group of 26-45 is 80% which is a followed by 65 + that is 70%.In addition, there is a yawning gap between the proportion of 25 years and 45-65 years age group. The respective ratio is 81% and 55%.
Moreover, the construction of butter in the age of 45-65 is almost 60% which is double the from 65 plus age group. The maximum proportion of full fat is contained by the youngster. While the age of 45-65 and 65+ are almost similar. Last but not least, the percentage of low-fat products in the 26-45 age group is approximately 12 times more than the age of 25 as well as the amount of adults is almost the same.
Overall, full-fat products are contained by young masses in higher quantities. However, load products are consumed by people who are in the age of 45-65.
Follow Us on IELTSFever Facebook
Also, Read Describe an Occasion When You Ate Something for the First Time