


The table beneath shows the level of specialists in various kinds of enterprises in 1990, 2000, and 2010. Sum up the data by choosing and writing about the primary capacities and make correlations where fitting.
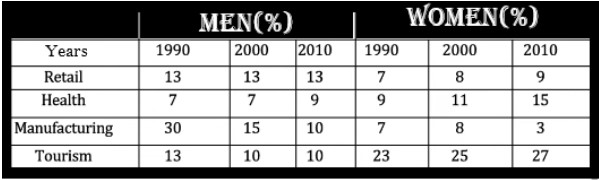
The information regarding both genders who were specialists in different sorts of enterprises in 1990,2000,and2010 is depicted by rendered table chart.
Commencing with 30%, which was the highest man specialist in the manufacturing sector in 1990, while in 2000, and 2010, there had been declined with 5%. However, only a negligible percentage (3%) of women employees were attracted towards manufacturing in 2010. Almost the same ratio(8%) of females was observed in the other two years. In the retail sector, the proportion of male employees remained stable at 13 percent over the two decades, while the ratio of females rose from 7% to 9 % by time.
Probing further, in the tourism domain, women’s attraction slightly inclined from 23 % to 27% in given three years, whereas the percentage fell for male employees from 13 % to 10%. The proportion of male employees in the health sector stood at 7% in 1990, while the figure for female employees was 9%. In 2010, both genders showed and the increase was noticed 9% and 15%, respectively.
Overall, it could be elucidated from the above graph that the manufacturing sector witnessed maximum percentage of men. Nonetheless, the minuscule proportion of women is revealed in the tourism field.
Follow Us on IELTSFever Facebook
Also Read The Chart Shows Days Taken Off Work Due to Stress-related Illnesses