The Bar Chart Shows the Number of Times per Week (in 1000s), Over Five Weeks, and Those Three Computer Packages Were Downloaded from The Internet.
 The bar chart illustrates the proportion of time each week people downloaded three different software, ActiveX, Java, and Net, from the internet over five weeks.
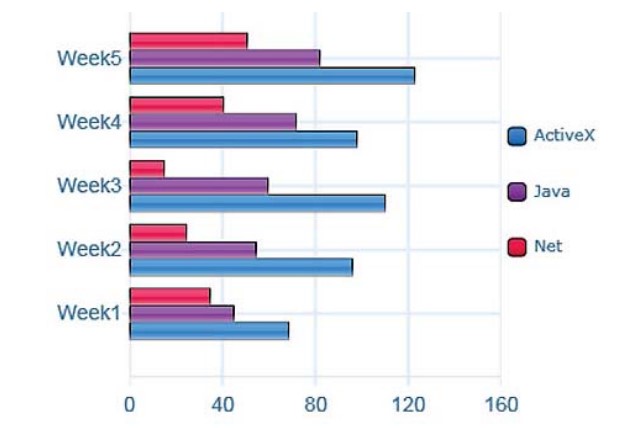
From an overall perspective, it is readily apparent that the maximum number of people downloaded ActiveX throughout the period. However, most of the downloading took place in the fifth week for each software, while people took the least interest in Net in the third week.
ActiveX was downloaded by more computer users than any other software, with around 70 downloads in the first week, which significantly increased to nearly 110 downloads in week 3. This dropped to approximately 100 downloads in week 4, the same as in the second week, and in the fifth week, it reached its peak with nearly 120 downloads, securing the top position among all the software.
Java was the second-highest downloaded software, starting with around 50 downloads in the first week and gradually increasing throughout the period to reach its peak at above 80 downloads in the final week. On the other hand, the Net was the least popular among users, with nearly 30 downloads in week 1, showing fluctuations throughout the period and reaching almost 60 downloads in the last week.
Follow Us on the IELTSFever Facebook Page For More Updates