The Climograph Below Shows Average Monthly Temperatures and Rainfall in The City of Kolkata. Summarise the Information by Selecting and Reporting the Main Features, and Make Comparisons Where Relevant.
 📊 The rendered bar graph depicts the information about the monthly weather of Kolkata. The data is calibrated in Celsius and millimetres.
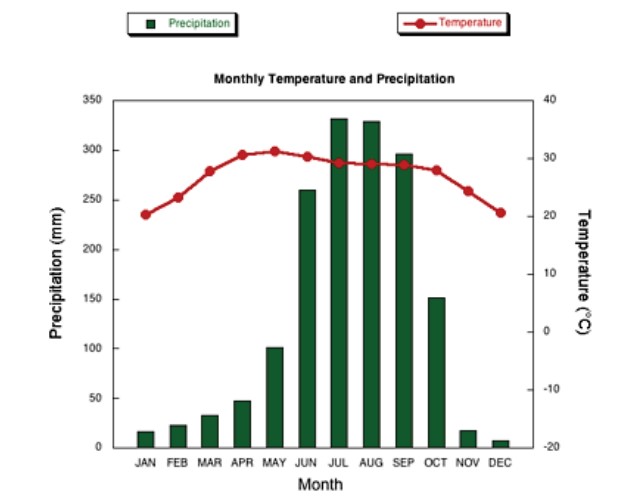
To outline the striking factor, it can be clearly seen that in July and August, the precipitation was the highest, while in December, it was the lowest.
To begin with, in January, Kolkata’s temperature was nearly 20°C, and it topped the list in May with 30°C. From May to September, the temperature remained identical at 30°C and then decreased dramatically in December to 20°C.
Moreover, precipitation in Kolkata in the starting month of the year was 10 mm. It increased significantly in June, reaching a peak of approximately 340 mm. Reaching 300 mm in September, it fell drastically to 150 mm in October. However, in December, the proportion of rain in Kolkata was just near 0 mm.
Follow Us on the IELTSFever Facebook Page For More Updates