The Graph Shows the Hours Spent on Different Study Methods During a Two-Year Course. Summarise the Information by Selecting and Reporting the Main Features and Making Comparisons Where Relevant.
 The bar graph shows information about the hours spent on different study methods over a two-year program.
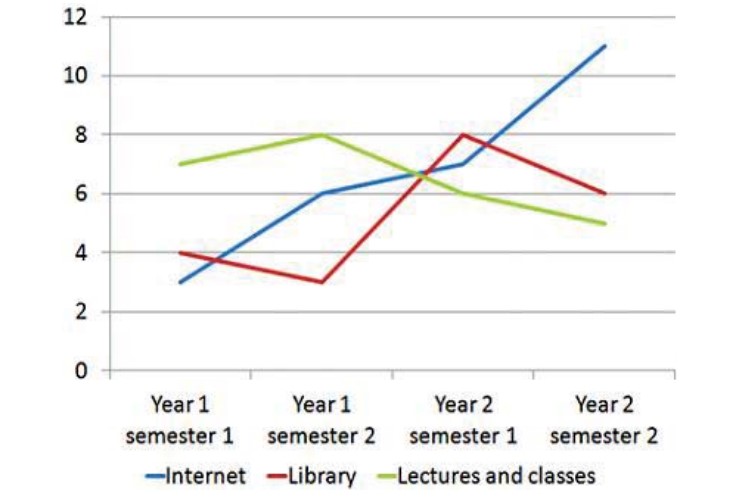
Attending lectures and classes is at the top in the first semester of the first year of the course. However, after an increase of around 1 hour in the second semester of the first year to around 8 hours, it starts to fall to about 6 hours in the first semester of the second year and finally stops at around 5 hours in the last semester of the second year.
The library shows many fluctuations throughout the course. It starts at around 4 hours and, after reaching the lowest point of 3 hours in the second semester of the first year, it begins to rise, reaching the highest point of 8 hours in the first semester of the second year.
Then it falls again to 6 hours in the last year of the course. The use of the Internet is at the top of the table. It starts at around 3 hours in the first semester and continues to rise, breaking at the highest point of all at around 11 hours in the last semester.