The Table Below Shows the Results of A Survey that sampled a Cross-Section of 100,000 People Asking if They Travelled Abroad and Why They Traveled for The Period 1994 – 1998. The bar Chart Shows Their Destinations Over the Same Period. Write a Report for A University Lecturer Describing the Information Shown Below.
 🎓 The table and bar chart illustrate the responses of 100,000 people sampled in a survey asking if they travelled abroad and their destinations between the years 1994 and 1998.
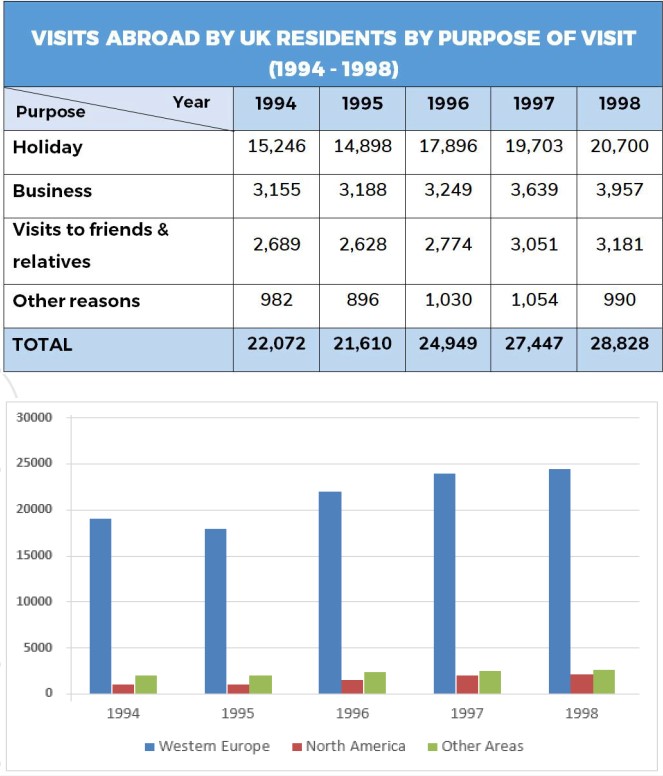
Overall, it is clearly shown that the main purpose of people travelling was for holidays, and the majority travelled to Western Europe.
The highest number of travellers was recorded in 1998, with a total of 28,828, out of which holiday travel was the highest reason at 20,700. In the same year, Western Europe was the most visited place, with about 25,000 visits. ✈️🌍
The least travelling was noticed in 1995, with a total of 21,610. The purpose and places visited followed the same trend as in the year 1998.
Furthermore, in the year 1994, the average number of travels made was 22,072, while in 1996, it was 24,949, with holidays being the leading purpose for travel. Other purposes were below 50% of holiday travel across the 4-year period. The destination pattern remained consistent as well. 🏖️📊
Follow Us on the IELTSFever Facebook Page For More Updates