The Table Shows the Percentage of People with Mobile Phones Who Use Various Features on Their Phones. Summarise the Information by Selecting and Reporting the Main Features and Making Comparisons Where Relevant.
 The tabular chart represents the information regarding the percentage of individuals who used their cell phones and various features in three different years 📊.
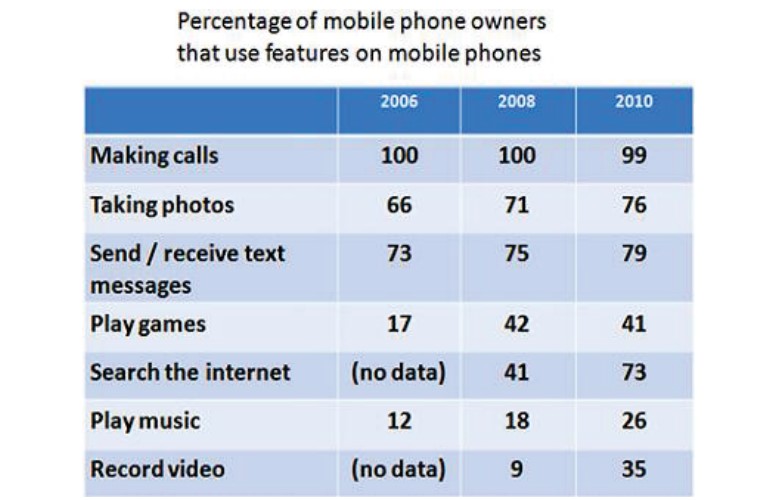
Overall, it is noticeable that the proportion of citizens making phone calls was high and almost similar every year 📞.
At a fleeting glance, it can be seen that in the initial year, very few people were interested in listening to and playing music, which doubled by 2010 🎵. In 2006, 66% of individuals were interested in taking photos, which increased to 71% in 2008 and 76% in 2010 📸. In the beginning year, no data was recorded for Internet usage and video recording, but in the next two years, it climbed to 41% and 9% in 2008 and 73% and 35% in 2010, respectively 🌐📹.
Regarding the percentage of mobile phone owners who used various features for sending and receiving texts, 73% of people were recorded in 2006, which was two percent higher in 2008 and three per cent higher in 2010 ✉️. On the other hand, the use of mobile phones for playing games was very low in the starting years but tripled by 2010 🎮.