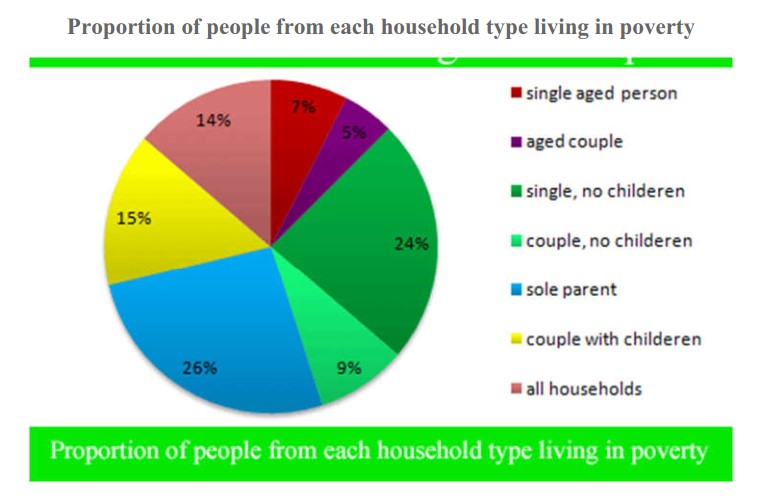
The pie chart below shows the proportion of different categories of families living in poverty in the UK in 2002. The proportion of people from each household type living in poverty. Summarise the information by selecting and reporting the main features, and make comparisons where relevant. Write at least 150 words.
Sample Answer of Proportion of Different Categories of Families Living in Poverty in the Uk in 2002
The given pie chart represents the percentage of seven types( single aged person, aged couple, sole parent, couple with children, all households, single and couple, no children ) of households living in destitution in the UK in 2002.
Overall, it is apparent that sole parent and single parent, with no children, had suffered more proportion than It is interesting to note that in 2002 percentage of people living in poverty with the sole parent are just over one fourth (26%) whereas, single, without children is under a quarter (24%), these two categories have taken half portion of destitution in the chart. Similarly, couples with children comprised 15%. 14% of all the households experienced poverty in that year.
The proportion of individuals existing in the category of the couple, no children is 9%. Likewise, the single older adult is 7%. The aged couple living in deprivation is just 5%.
Follow Us on Facebook
Also, Read Percentage of Housing Owned and Rented in the Uk in 1991 and 2007
