The Chart Below Gives Information About the Age of Women in Australia when They Gave Birth to Their First Child in 1966, 1986 and 2006. Summarize the Information by Selecting and Reporting the Main Features and Making Comparisons Where Relevant.
📊 The bar chart illustrates when women in Australia had their first child from 1966 to 2006. Looking from an overall perspective, it is readily apparent that women in the past tended to have their first child earlier in life, especially very young women. Having a child in one’s 30s became much more common, though after one’s 30s, it remained relatively rare.
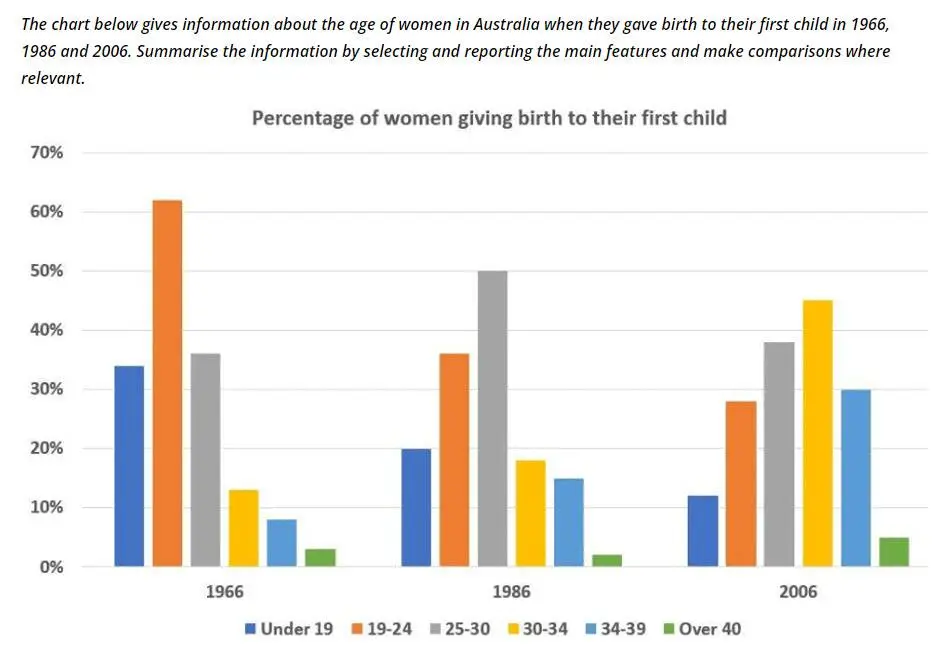
In 1966, 33% of women had their first child under 19. This figure dropped precipitously to reach 11% by 2006. The data for women aged 19-24 underwent a similar drop, falling from 62% to 50% and finally to 28%.
In contrast, 36% of women were 19-24 years old when they first gave birth in 1966, and this number then rose to 50% in 1986 before dropping back to just above the original figure to end the period. The largest rise occurred in the 30-34 age range, which more than quadrupled (from 11% to 18% to 45%).
This paralleled the growth for ages 34-39, nearly doubling every 20 years from 9% to 17% and lastly to 30%. Finally, there was little change for women over 40 despite marginal growth from 3% to 5%.
Follow Us on the IELTSFever Facebook Page For More Updates