The graph below gives information about the number of Catholics residing in different nations, during 2010-2013. Summarise the information by selecting and reporting the main features, and make comparisons where relevant.
Sample Answer of The Graph Below Gives Information About the Number of Catholics Residing
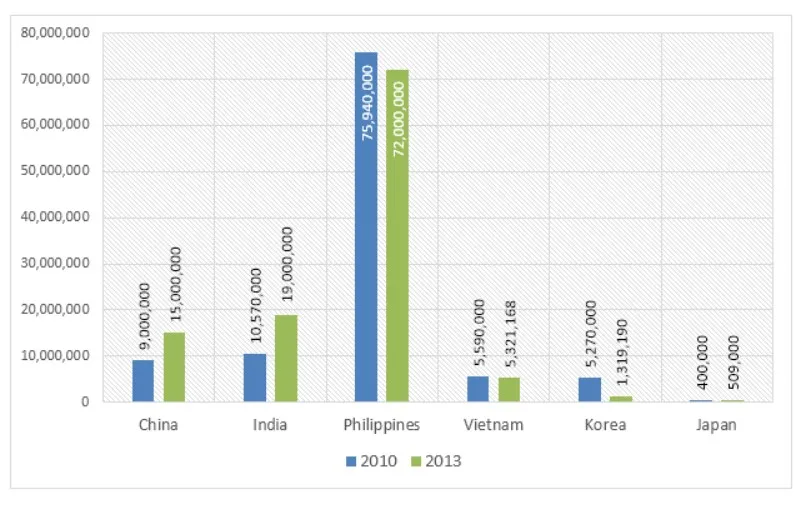
The given bar chart illustrates the number of catholic people migrating to different countries in 2010 and 2013.
Overall, from the given bar chart, it is clear that in the Philippines, the number of Catholic people was residing more as compared to Japan, where the population was low in 2010 and 2013.
First and foremost, in 2010 Philippines was the only country has more population than other countries with 75,940,000. At the same time, Japan has only 400,000, which is less than other countries. And, Vietnam with catholic people 5,590,000. Furthermore, In China, India and Korea migration population is ( 9,000,000 , 10,570,000 ,and 5,270,000 ) respectively.
In 2013, the migration population was increasing in all the nations except Japan and Korea, where the population is decreasing. Highest population in the Philippines with 72,000,000. And, in China, India and Vietnam with ( 15,000,000 , 19,000,000 and 5,321,168 ) respectively. However, in Korea and Japan, the population seen 1,319,190 and 509,000, respectively.
Follow Us on IELTSFever Facebook