The Graph Shows the Average Annual Expenditure on Cell Phones and Residential Phone Services. Summarise the Information by Selecting and Reporting the Main Features, and Make Comparisons Where Relevant.
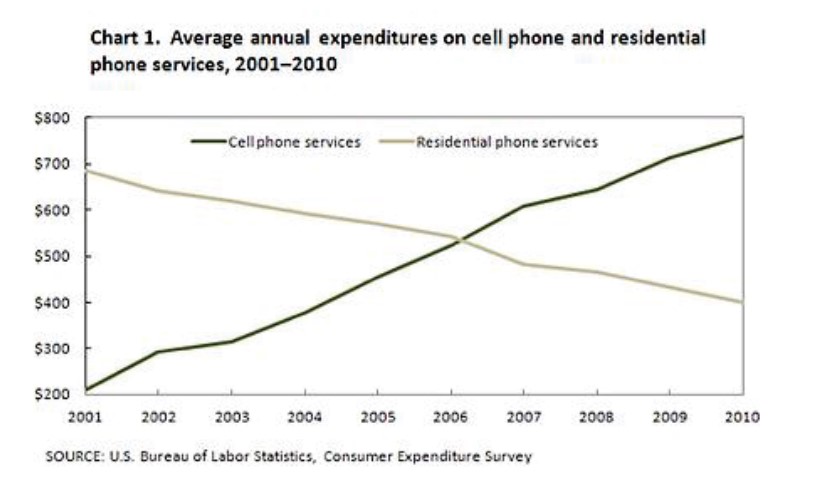 📊 The provided line graph illustrates the information about the proportions of yearly costs on mobile and residential phones from 2001 to 2010.
Overall, there has been an increase in the expenditure on cell phones over the period, whereas residential phone service expenditure has declined tremendously.
To commence with, it is clear from a glance that in the beginning year, 2001, dollar spending on cell phones was low, while spending on landline phones was around $700. In the next two years, both services saw a decline. From 2004 to 2007, expenditure on digital telephones sharply rose by $700. However, there was a quick fall to $400 by 2010.
Probing ahead, fluctuations were observed from 2007 to 2008. However, the amount spent on cell phone services increased by $750 from 2008 to 2010.
Follow Us on the IELTSFever Facebook Page For More Updates