The table below shows social and economic indicators for four countries in 1994, according to United Nations statistics. Describe the information shown below in your own words. What implications do the indicators have for the countries?
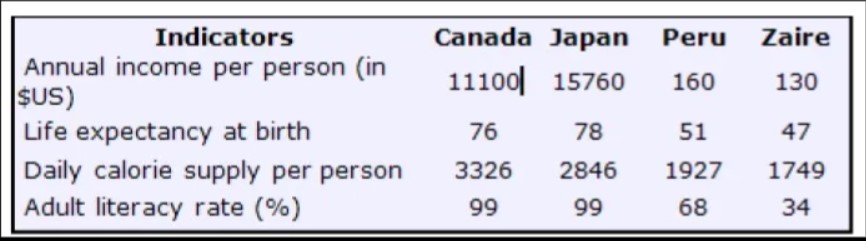
The table illustrates the UN’s data regarding social and economic indicators for Canada, Japan, Peru and Zaire in the year 1994.
All in all, it is witnessed that Canada and Japan were developed in terms of social and economic indicators. However, Peru and Zaire were noticed to be undeveloped, with relatively low annual income, life expectancy, daily calorie supply and adult literacy rates.
As the data suggests, the yearly income of every individual in Japan was maximum, accounting for 15760 dollars. Similarly, Canadians earn just over $11000 each year. In contrast, residents of Peru and Zaire made less than $200, which was almost 100 times slower than the other two countries. In addition, adults of both Canada and Japan were 99% literate whereas young people of Peru and Zaire were 68% and 34% educated as per the year 1994.
With regards to life expectancy at birth, people of Japan lived the longest at 78 years, while pupils of Peru and Zaire survived around half-century. Furthermore, every individual in Canada consumes more than 3000 calories every day. Following that, this figure was quite low in Japan, depicting 2846 calories. On the contrary, a supplement of daily calories for Peru and Zaire was around 1500, which was half of those in Canada and Japan.
Follow Us on IELTSFever Facebook