The table shows the Proportion of Pupils Attending Four Secondary School Types Between 2000 and 2009. Summarise the information by selecting and reporting the main points and give comparisons where relevant.
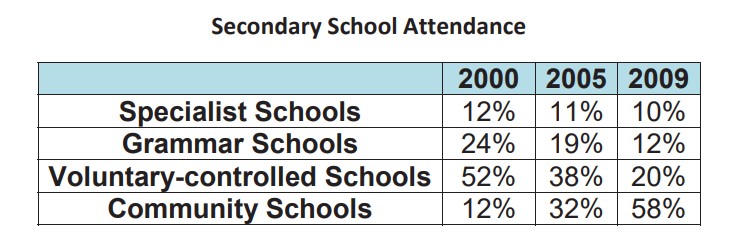 The table chart illustrates the information about the percentage of pupils attending different types of secondary schools from 2000 to 2009.
Overall, it is clearly visible that attendance at community schools increased, while attendance at other schools, such as specialist schools, grammar schools, and voluntary-controlled schools, decreased over the years.
Also, Read Describe a Daily Routine that You Enjoy
Taking into account the given data, in 2000, voluntary-controlled schools had just over half the proportion of student attendance at 52%, which was higher than the percentage of other secondary school attendance. On the other hand, in 2009, the attendance of voluntary-controlled schools drastically dropped down and reached only 20%.
Now, considering the other information, in the years 2000, 2005, and 2009, attendance at specialist schools slightly decreased in sequence, to 12%, 11%, and 10%, respectively. Moreover, the attendance of community schools significantly increased from 12% in 2000 to 58% in 2009.
Furthermore, specialist and community schools had an equal percentage of student attendance in the year 2000, only 12%.
Follow Us on the IELTSFever Facebook Page For More Updates