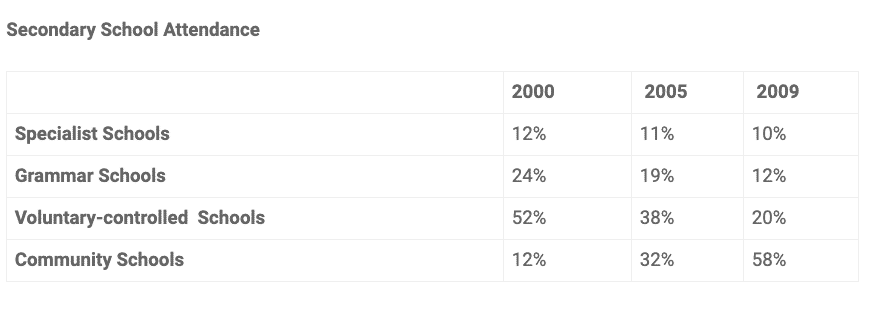
Academic Writing Task 1

Information About “istanbul Promo Plus” Sales in 2007 (1)

Information About “istanbul Promo Plus” Sales in 2007

The chart below gives information about “Istanbul Promo plus” sales in 2007. Summarise the information by selecting and reporting the main features, and make comparisons where relevant. Write at least 150 words. Sample Answer of Information About “Istanbul Promo Plus” Sales in 2007 The line chart illustrates about Istanbul Promo Plus scheme sales in the […]

Information About “istanbul Promo Plus” Sales in 2007 Read More »

Manufacturing Process for Making Sugar From Sugar Cane

Manufacturing Process for Making Sugar From Sugar Cane

The diagram below shows the manufacturing process for making sugar from sugar cane. Summarise the information by selecting and reporting the main features, and make comparisons where relevant. Sample Answer of Manufacturing Process for Making Sugar From Sugar Cane The drawing given illustrates the production of sugar from sugarcane with a complete process. This process

Manufacturing Process for Making Sugar From Sugar Cane Read More »

The Graphs Show Changes in the Spending Habits of People

The Graphs Show Changes in the Spending Habits of People

The graphs show changes in the spending habits of people in the UK between 1971 and 2001. Write a report to a university lecturer describing the data. Write at least 150 words. Sample Answer of The Graphs Show Changes in the Spending Habits of People The given two pie charts depict the proportion of household

The Graphs Show Changes in the Spending Habits of People Read More »

Number of Travellers Using Three Major German Airports Between 2007 and 2012

Number of Travellers Using Three Major German Airports Between 2007 and 2012

The table below highlights data on the number of travellers using three major German airports between 2007 and 2012. Summarize the information by selecting and reporting the main features, and make comparisons where relevant. Write at least 150 words. Sample Answer of Number of Travellers Using Three Major German Airports Between 2007 and 2012 The

Number of Travellers Using Three Major German Airports Between 2007 and 2012 Read More »

Information on Uae Government Spending in 2000 (

Information on Uae Government Spending in 2000

The pie chart gave information on UAE government spending in 2000. The total budget was AED 315 billion. Summarize the information by selecting and reporting the main features, and make comparisons where relevant. Write at least 150 words. Sample Answer of Information on Uae Government Spending in 2000 The pie chart illustrates the money devoted

Information on Uae Government Spending in 2000 Read More »

Changes in Exports in Hk Billions Between 2009 and 2010 (1)

Changes in Exports in Hk Billions Between 2009 and 2010

The table below shows the changes in exports in HK billions between 2009 and 2010. Summarize the information by selecting and reporting the main features, and make comparisons where relevant. Write at least 150 words. Sample Answer of Changes in Exports in Hk Billions Between 2009 and 2010 The table illustrates the changes in exports

Changes in Exports in Hk Billions Between 2009 and 2010 Read More »

Number of Visitors to Three London Museums Between 2007 and 2012

Number of Visitors to Three London Museums Between 2007 and 2012

The bar chart shows the number of visitors to three London Museums between 2007 and 2012. Summarize the information by selecting and reporting the main features, and make comparisons where relevant. Write at least 150 words. Sample Answer of Number of Visitors to Three London Museums Between 2007 and 2012 The bar chart illustrates how

Number of Visitors to Three London Museums Between 2007 and 2012 Read More »

The Line Graph Shows Paris Metro Station Passengers (1)

The Line Graph Shows Paris Metro Station Passengers

The line graph shows Paris Metro station passengers. Summarise the information by selecting and report in the main features, and make comparisons where relevant. Write at least 150 words. Sample Answer of The Line Graph Shows Paris Metro Station Passengers The line graph illustrates the number of travellers using the Paris metro station during the

The Line Graph Shows Paris Metro Station Passengers Read More »

Sales Figures for Reading Materials From 2002 to 2012

Sales Figures for Reading Materials From 2002 to 2012

The bar graph indicates sales figures for reading materials from 2002 to 2012. Write a report to a university lecturer describing the information shown below. Write at least 150 words. Sample Answer of Sales Figures for Reading Materials From 2002 to 2012 The given bar charts demonstrate the reading materials, hobbies books, entertainment books, history

Sales Figures for Reading Materials From 2002 to 2012 Read More »

Hours Worked and Stress Levels Amongst Professionals in Eight Groups

Hours Worked and Stress Levels Amongst Professionals in Eight Groups

The graphs show figures relating to hours worked and stress levels amongst professionals in eight groups. Describe the information shown to a university or college lecturer. Write at least 150 words. Sample Answer of Hours Worked and Stress Levels Amongst Professionals in Eight Groups The provided bar charts demonstrate eight groups per week working hours, and

Hours Worked and Stress Levels Amongst Professionals in Eight Groups Read More »