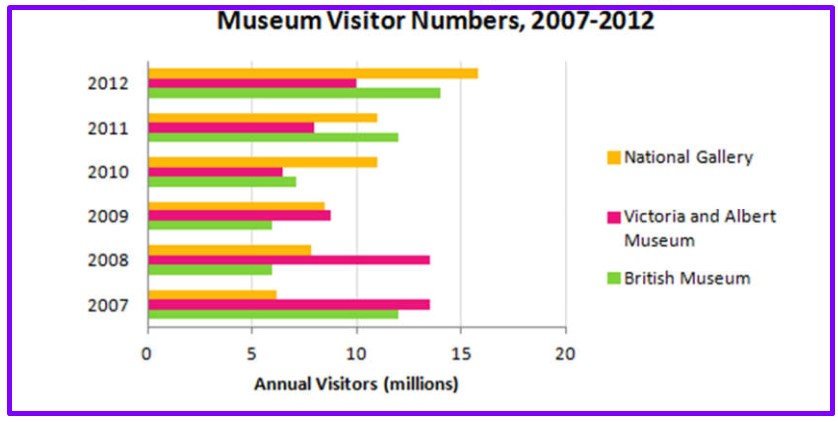
The bar chart shows the number of visitors to three London Museums between 2007 and 2012. Summarize the information by selecting and reporting the main features, and make comparisons where relevant. Write at least 150 words.
Sample Answer of Number of Visitors to Three London Museums Between 2007 and 2012
The bar chart illustrates how many individuals visited three various museums in London over the 5 years period from 2007 to 2012. Overall, the National Gallery had an increasing trend, whereas Victoria and Albert’s museum decreased throughout the period.
As can be observed from the graph, in 2007, the National gallery had just more than 5 million visitors. However this number rose to over 15 million after five years, and this was the highest number of annual visitors than other museums. Also In 2010 and 2011, the number of people who visited it was the same, which was almost 11 million.
Almost 12 million individuals visited British museums in 2007; this count declined dramatically in 2008 to around 6 million and had the same visitors after a year. This number suddenly went up after 2009 every year and settled to 14 million in 2012.
With regard to Victoria and Albert Museum, the number of individual people who visited was more than other places in the first 2 years, around 13 million. In 2009, it dropped to 8 million. Although there was a growing trend after 2009, the number was less than other museums in the last three years.
Follow Us on Facebook
