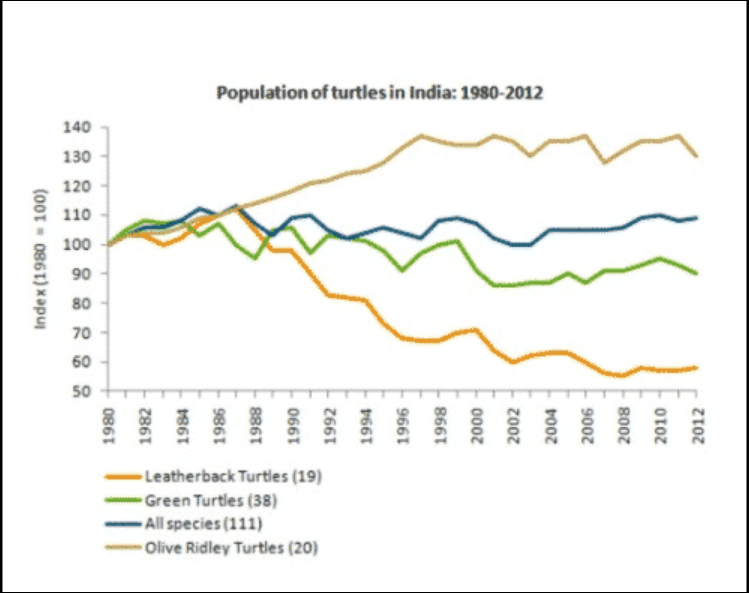
The Graph Below shows the population figures for different types of turtles in India from 1980 to 2010

You should spend about 20 minutes on this task.
Sample Answer of population figures for different types of turtles in India
The graph represents the change in the population of various kinds of turtles (Leatherback turtles, Green turtles, Olive Ridley turtles, and the rest of the species) from the year 1980 to 2012, in India. We are initiating 100 turtles of each kind from the year 1980. Overall, we see a rise in the population of Olive Ridley turtles whereas there has been a steep decline in the population of Leatherback turtles.
There has been a gradual increase in the population of Olive Ridley turtles from 100 in 1980 to around 135 in 1997. For the next four years, despite its ups and downs, the number remains the same in 2001. We see the same trend till 2011 where the population is still 135. But in 2012, there has been a decline in its population with numbers going down to 125.
For the Green turtles, the numbers never went up and they kept on decreasing from 100 to around 95 in 1988 and 90 in 1996. We see a gradual increase in the population over the next 3 years with the numbers reaching 100 again in 1999 but since then they kept on decreasing with the final count as 85 in the year 2012. In the case of Leatherback turtles, we see an increase in the population from 100 to 110 in 1997 but after that, there has been a steep decline in its population with numbers going as low as 60 in 2012.
For the rest of the species, despite its ups and downs, there has been an overall increase in the population with numbers going up to 110 in 2012.
Also, Check Your car insurance company has told you that they are going to increase