The table shows the Proportions of Pupils Attending Four Secondary School Types Between 2000 and 2009.
Summarize the information by selecting and reporting the main features and make comparisons where relevant.
Sample Answer of Proportions of Pupils Attending Four Secondary School
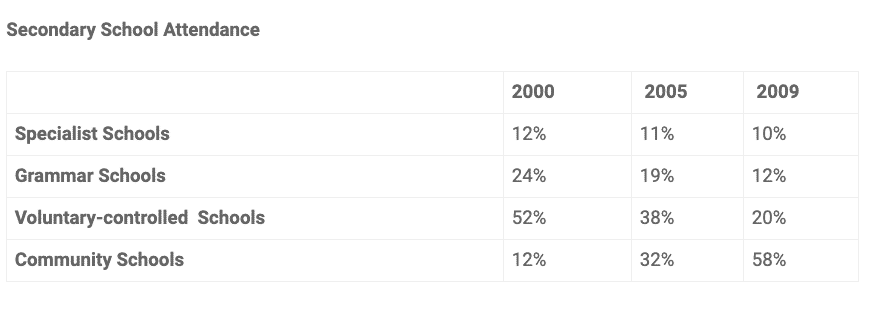
The tabular chart manifests the information regarding the ratio of scholars who opted for distinct secondary schools namely, specialist schools, grammar schools, voluntary controlled schools, and, lastly, community schools, from 2000 to 2009.
Overall, the spreadsheet vividly reveals that in the first tenure voluntary school was most eminent among students whereas its per centum was declined in the subsequent years. However, community schools became renowned among pupils.
As is presented in the table graph, the proportion of specialist school’s learners was more or less stable throughout the timescale. They were 12% in 2000 and one-tenth in 2009. In 2000, the percentile of scholars was nearly a quarter. After that, they consistently decreased and reached at the half until 2009. In case the of voluntary controlled schools and community schools, the lion’s share (52%) pupils were interested in the former and merely 12% went to the latter school, in 2000.
Follow us on IELTSFever Facebook Page
Furthermore, in 2005, the proportion of learners who attend voluntary controlled school ware plummeted just as 38% and the community school’s pupil were inclined. Finally, community school becomes most eminent among students, and voluntary controlled school’s ratio of pupils was two-fold, in 2009.
Also, Read The Table Illustrates the Breakdown of the Score for the IELTS
The table shows the proportions of pupils attending four secondary school types between 2000 and 2009.
The given representation shows information about the percentage of students enrolled in four different kinds of schools between 2000 and 2009.
Overall, It is clear that the highest proportions of student attendance in specialist schools, grammar schools, voluntary controlled schools decreased in the graph.. on the other side,
community school was increased
To start with, in 2009, voluntary controlled schools shows a higher percentage at 52%.compare to the other four kinds of schools but in more in two years. It was decreased by 20% in 2000. The percentage of the students enrolling in grammar schools (24%) .12%of pupils attending specialist schools and community schools for each. Moving ahead In 2009 specialist schools and grammar saw a slight decrease to 12 %and 10% respectively. Moreover, voluntary controlled, schools also decline dramatically to only 20% in the last formality school significant increase of students attendance from 12%in 2000 to
58%in 2009.