The Chart Below Shows The Global Sales of Different Kinds of Digital Games From 2000 to 2006. Summarize the information by selecting and reporting the main features, and make comparisons where relevant.
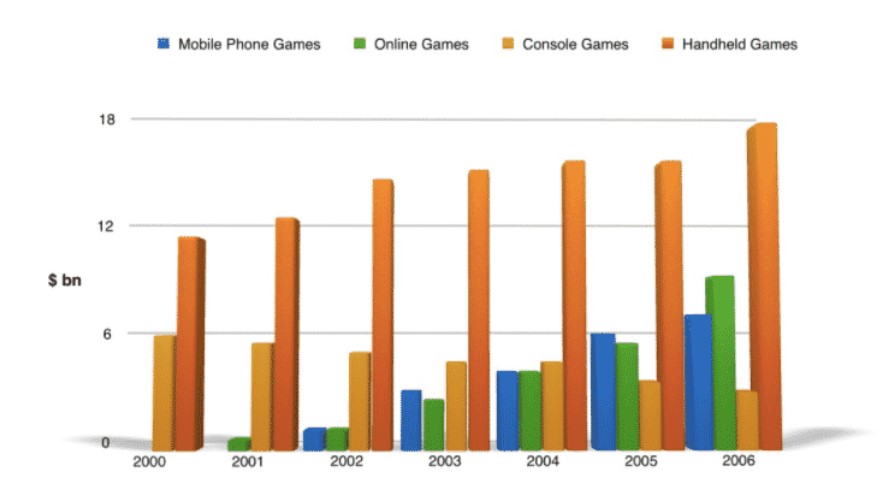
The vertical bar graph elucidates the information regarding the universal sales of multifarious electronic games, namely, mobile phone games, online games-the games which play with the help of the internet –console games and, lastly, handheld games from the year 2000 to 2006.
Overall, the most striking feature is that most of the money had been spent on handheld games by folks throughout the given tenure, and the rate was about 18 billion dollars in the last year.
It is evident from the bar chart that the mobile phone games started their earning growth from 2002 to 2005 and followed the increasing trend. At the same time, the opposite trend was followed by the sales of console games from 6 billion dollars to approximately 3 billion dollars in the final year. Moreover, the online games had had the second position in the universal sales in the stipulated period. The major earning came from those people who brought handheld games. Interestingly, the rate of these earnings in the initial year was at the peak level and highest among all the other games till the year 2006.
Follow Us on IELTSFever Facebook