The diagrams below show the main reasons workers chose to work from home and the hour’s males and females worked at home for the year 2019. Summarise the information by selecting and reporting the main features, and make comparisons where relevant.
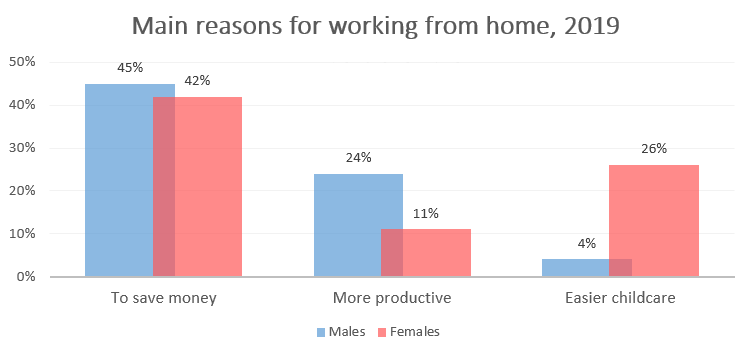
The bar graph illustrates information about men and women adopting work from the home culture in order to spend more working hours to take care of their children, for cost optimization, and to become productive—the data measured in percentage (%) for the given year of 2019.
It is conspicuous from the provided graph that for working from home, Males category dominated especially in terms of saving on money and productive nature over the women divisions. On the other hand, this trend is depicted on the plunge side if we talk about childcare by males for the year 2019.
Explicitly, It is readily apparent from the given graph that while working from home, Men were almost over double the women for more productivity in 2019. In a comparison of saving of money and productive nature, men were almost near to double with 45%, besides women were approximately fourth time higher (42%) in the year of 2019.
On further scrutiny, there was surprising data on the reason for easier childcare where mothers were marginally higher compared to fathers with 26%. Last but not the least, for money optimization, both males and females had only a 3% difference for a given year.
Follow Us on IELTSFever Facebook
Also read: The Maps Below Show University Sports Courts in 1990 and Now
