The graph below shows the average monthly use of health clubs in Miami and Florida by all full-time members in 2017. The pie charts show the age profile of male and female members of this health club. Summarise the information by selecting and reporting the main features, and make comparisons where relevant.
Sample Answer of The Graph Below Shows the Average Monthly Use of Health Clubs in Miami and Florida
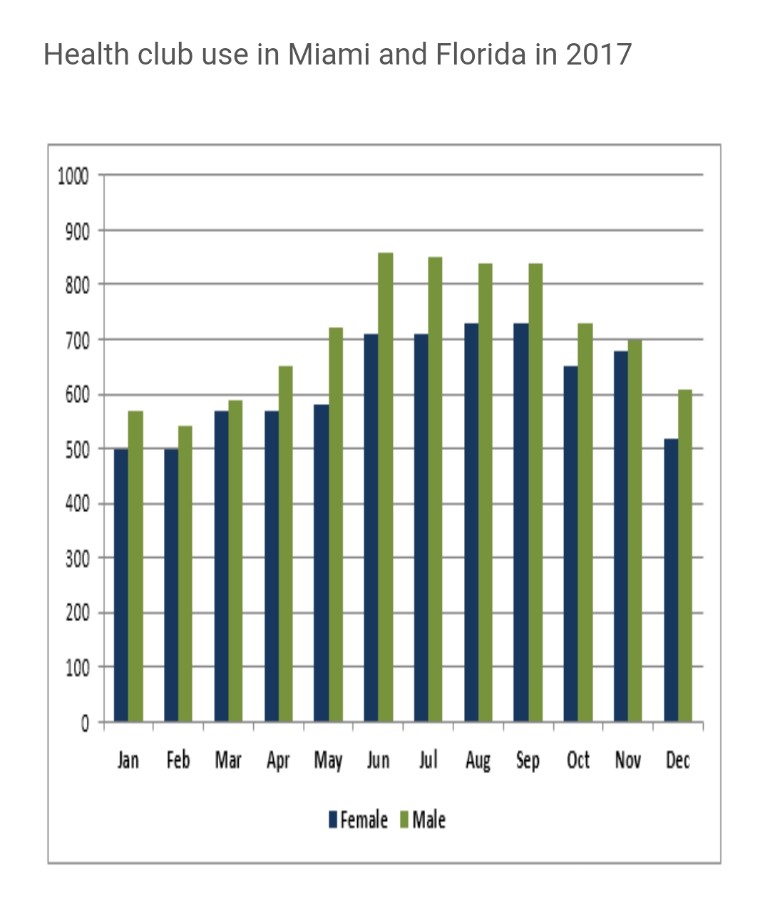
The given bar chart depicts the information of average utilisation of the health centres by full-time subscribers of Miami and Florida in each month of the year 2017.
Overall, over the year, men were consistently using the health centres more frequently than women. However, at the end of the year, a slight decline in both can become noticeable.
The average monthly usage of women in the starting month of 2017 was 500, which was 80 less than of men. The highest male average consumption of health centres was spotted in the month of June which was nearly 850, whereas in the females higher utilisation was on the August with over 700, active participation which remained static in September as well.
The average usage of men remarkably plummeted in the remaining months, whereas the figure of women insignificantly fluctuated but reduced. In the final month of 2017, the active participation of men and women in health centres was nearly 600 and 500, respectively. The average difference between both genders was nearly 100.
Follow Us on IELTSFever Facebook
Also, Read Number of Visitors to Four London Museums