The table shows the proportions of pupils attending Four Secondary school Types between 2000 and 2009. Summarize the information by selecting and reporting the main features and making comparisons where relevant.
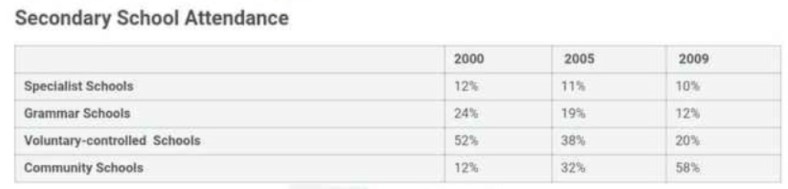
The tabular chart depicts the ratio of people joining Specialist, Grammer, Voluntary-controlled and Community schools from 2000 to 2009.
In 2000 there were 12 percent people who joined the specialist school, which declined by 1 percent in the year of 2005. On the other hand, there was a 20 percent rise has been seen among those who attended the community school in the same time span. After 2005 it was increased by 26 percent, which was 58 percent in 2009.
A drastic fall has been noticed in Voluntary-controlled schools, which declined up to 38 percent, which was 58 percent earlier. After four years it was again decreased by 18 percent. In 2005 there was 19 percent of school-goers joined the grammar school, which later decreased by 7 percent.
Overall, A negligible decrease was seen in the children who joined the Specialist school. At the same time, the only increase has been observed in those who joined the community school.
Follow Us on IELTSFever Facebook
Also read: The Table Beneath Shows the Level of People Specialists in Various Kinds of Enterprises