The graph below shows radio and television audiences throughout the day in 1992. Summarise the information by selecting and reporting the main features and make comparisons where relevant.
Sample Answer of Radio and Television Audiences Throughout the Day in 1992
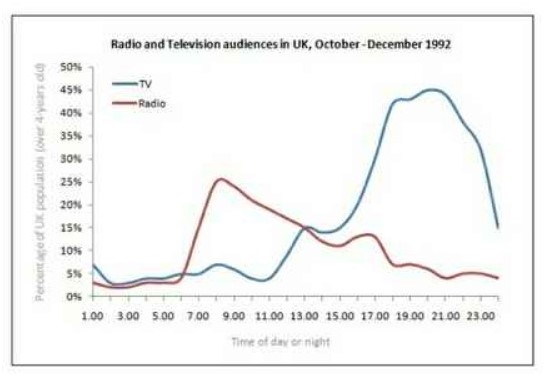
The line chart provides the information about how many British civilians watched television and listen to the radio at various times in a day, from
October to December, in the year 1992. Generally speaking, most individuals watched TV at midnight, and Radio is popular in the morning.
It can be clearly seen that Around 5% of the audience watched television at night. However, this proportion had an upward trend after 11 a.m. and reached about 15%. Furthermore, the ratio of television watchers skyrocketed after 1 p.m. and reached the highest point, at approximately more than two-fifth. After that, this trend went down dramatically. In the time period of 3 p.m. to 11 p.m., tv viewers were more than radio viewers.
Concerning the Radio audience, less than 5% of people listened to the radio, after 6 a.m. the percentage grew significantly, at nearly one-fourth. Since morning time most of the individual people preferred to listen to radio more than television, this trend went down gently after 13:00 and only 5% of UK residence enjoyed it at night.
Follow Us on Facebook
Also, Read Graphs Show the Nutritional Consistency of the Two Dinners