The chart below gives information about global sales of games software, CDs and DVD or video. Summarise the information by selecting and reporting the main features, and make comparisons where relevant.
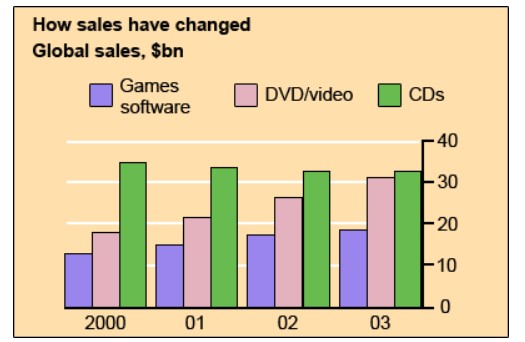
The render bar chart enumerates how sales of games software, CDs and DVD or video changed from 2000 to 2003, and the data was in $bn.
Overall, it can be seen that Games software had the least sales whereas CDs had the majority of global sales. Additionally, all products sales were surged year by year except CDs.
For Games software, in 2000, this global product sales was $12 bn which grew later $2 bn per year, sales were $18 bn in 2003. For DVD/video, global sales value was the same in 2000 as Games software had in 2003. In 2001 it was $22 bn and $27 bn in 2002. Moreover, in the last year sales was at the peak on account of $31 bn.
For CDs, the highest sold product in 2000 was this on account of $34 bn. These sales remained untouched for three continuous years with slightly shrunk. Furthermore, in 2003, global sales were $33bn and remained the major sales throughout the period.
Follow Us on IELTSFever Facebook