The chart below shows the amount spent on six consumer goods in four European countries. Write a report for a university lecturer describing the information shown below.
The chart below shows the amount spent on six consumer goods in four European countries.
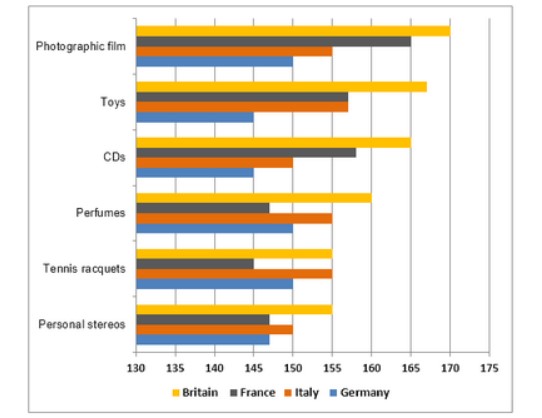
The horizontal bar graph illustrates the proportion of amount utilized on six consumer goods in four European countries.
Overall, it can be said that all four countries spent large amounts of money on photographic films, whereas in the case of personal stereos, all four countries spent less amount of money.
Getting back to the details, Britain spend 170 amount on photographic film, while 155 amount on tennis racquets and personal stereos. As for toys and CDs, Britain spends around 165 amount. However, 160 spent on perfumes. France utilizes 160 amount of photographic film, while 155 is spent by Italy. In contrast, Germany spent 150 on photographic film. with regards to toys and CDs, France and Italy accounted for around 155, whilst Germany spent less, which is 145.
Moving ahead, Turning to perfumes and tennis racquets, France and Italy made up approximately 290(collectively) and 310 (collectively), respectively. At the same time, Germany spends around 300, collectively. For personal stereos, France and Germany both spend the same amount, which is nearly 145, while Italy spends 155.
Follow Us on IELTSFever Facebook