The chart below shows the total number of minutes (in millions) of telephone calls in Finland, divided into three categories, from 1995 – 2004. Summarise the information by selecting and reporting the main features, and make comparisons where relevant.
 Sample Answer of The Chart Below Shows the Total Number of Minutes (in Millions) of Telephone Calls in Finland
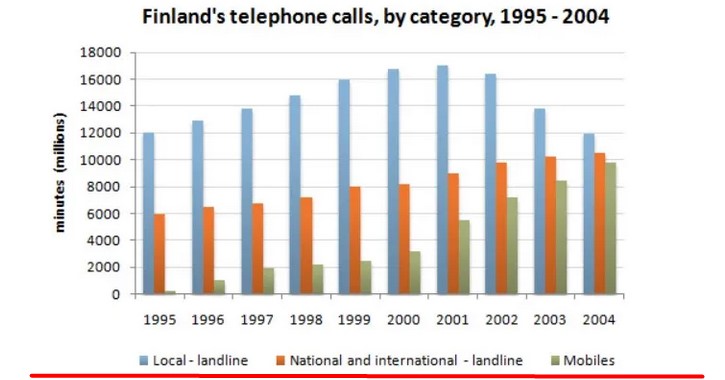
The bar chart illustrates the information about the total number of minutes of telephone calls which were used by three different categories from 1995 to 2004. The data is calibrated in millions.
They were commencing at 12000 million minutes, which were utilised by local landline, while from 1996 to 2001 this amount increased slightly approximately from 13000 million to 1 700 million. After that, there was a downward trend noticed in last three years and the number of minutes stayed at 1200 million in 2004.
Probing further, the number of minutes spent by national and international landline and mobile was 6000 million and almost 1000 million respectively, in beginning years. Interestingly, national and international landline and mobile categories showed an upward trend till 2004. In the former case, it rose to 1000 million minutes and the latter was below 1000 million minutes.
To conclude, it is analysed from the above discussion that although in starting years people of Finland preferred to use more local landline, in ending years they started using a national and international land line and mobile.
Follow Us on IELTSFever Facebook