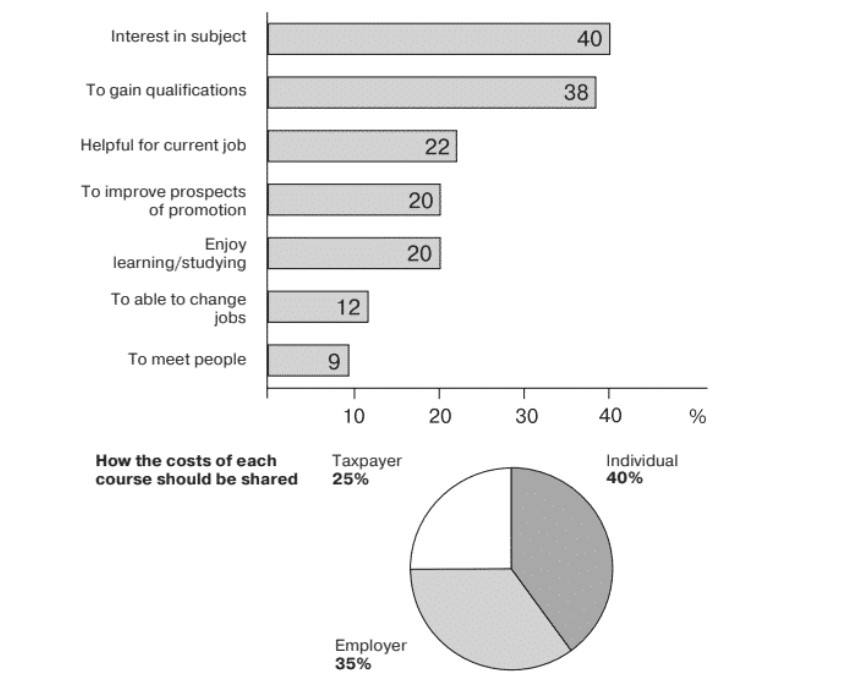
The charts below show the results of a survey of adult education. The first chart shows the reasons why adults decide to study. The pie chart shows how people think the costs of adult education should be shared. Write a report for a university lecturer, describing the information shown below.
The rendered bar graph and circular presentation demonstrate the information about the cause of studying by youngsters and the cost of their education should be shared among individuals, taxpayers and employers. The data has been calibrated in per centrum.
Overall, it is worthy enough to the point that great enthusiasm is the main motive behind their study and the fees of their course should be shared among employer and taxpayer.
To embark with, according to the bar graph,9%of the student like to study because they want to meet new people. Moreover,12percent of the adults decide to take education for the migration of their jobs (or change their jobs). Moving on, the proportion is approximately similar for the adults who want to enjoy their learning, get promotion for their career and for continuing their current job that is stood up at nearly 22%. Apart from it, 40%percents students decide to do the study because of their great interest in it that was closely followed by the adults who have the need to get qualifications(38%).
Moving ahead, In the pie chart according to a few people the cost born by individuals is less than half(40%), and the rest of the fees should be paid by employer with the proportion of a third in the fees(35%), and 25 per cent of the adult fees should be charged from the taxpayers.
Follow Us on IELTSFever Facebook