The diagrams below give information on transport and car use in Edmonton. Summarise the information by selecting and reporting the main features, and make comparisons where relevant.
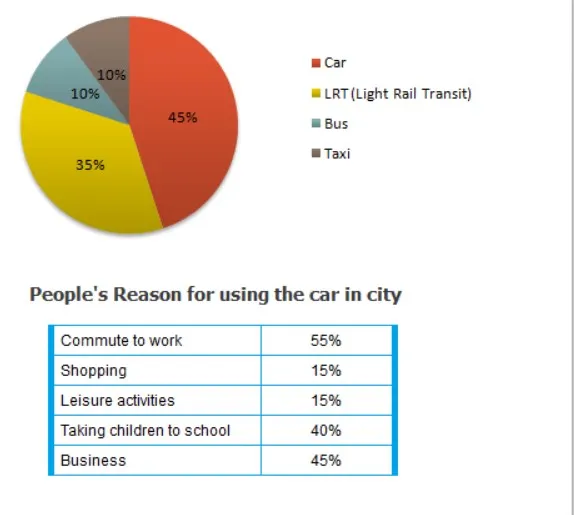
The first picture explains the information on how people commute to different places by car, Light Rail Transit(LRT), Bus and taxi. The second diagram also gives information on reasons people commute in a car to work, shopping, leisure activities, taking children to school and for their businesses.
The first diagram clearly shows that many people convey in the car than any other transport which gives the overall conclusion that LRT, Bus and Taxi are less use in Edmonton city. People in Edmonton city commute by car to workplaces than any other place, as the second diagram explains.
A greater number of people commute by car, with a percentage of 45 and 35% of people in Edmonton city using LRT. Comparably, the percentage of people commute by Bus and Taxi equalizes by 10% and covers the lesser part of transport as compared to Car and LRT.
People in Edmonton city explain their reasons to commute by car to different places in the second diagram, and 55% of people use the car to the workplace, which ranked the highest use of the car by the people of Edmonton. Following by car transit to businesses with covers 45% and it exceeds people who use the car to take the wards to school with just 5%. Obviously, 40% uses a car to send their kids to school. People who choose the car for shopping and for leisure activities are equal with 15% per cent.
Follow Us on IELTSFever Facebook