The graphs show changes in the spending habits of people in the UK between 1971 and 2001. Write a report to a university lecturer describing the data. Write at least 150 words.
Sample Answer of The Graphs Show Changes in the Spending Habits of People
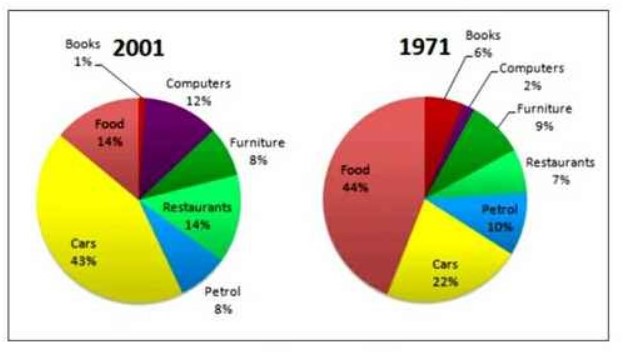
The given two pie charts depict the proportion of household spending by the people in the UK in the years 1971 and 2001. Overall, it is apparent that people spent the majority of their money on cars over the 30 years period. Food is the second most hobby of the people.
Consumption of food by people comprised 44% in the first year, which shows a drop of about 30% to 14% in 2001. Likewise, in 1971, money spent on books was 6%, dropping dramatically to 1% 30 years later. In much the same way, cash was spent on furniture 9% which fell slightly to 8%. Spending habit of people on petrol took a slight fall 10% in 1971 to 8% in 2001.
From 1971 to 2001, people’s expenditure on cars was rose rapidly from 22% to 43%. Similarly, money spent on restaurants grew substantially from 7% to 14%. Likewise, individual’s expenditure on computers escalated sharply from 2% to 12%.
Follow Us on Facebook
Also, Read Some Say That Due to Heavy Traffic Government Needs to Build More Roads