The line graph shows Paris Metro station passengers. Summarise the information by selecting and report in the main features, and make comparisons where relevant. Write at least 150 words.
Sample Answer of The Line Graph Shows Paris Metro Station Passengers
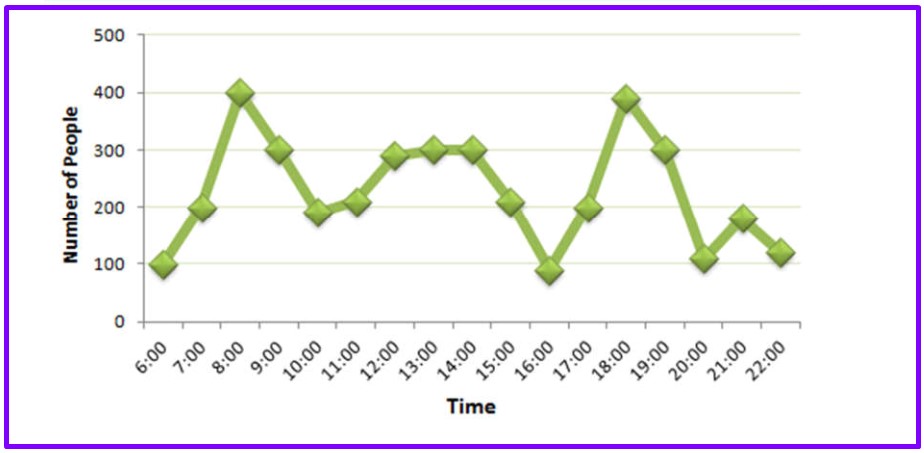
The line graph illustrates the number of travellers using the Paris metro station during the day. Overall, the graph shows that the most crowded period is in the early morning and evening.
Looking at the details, the busiest time of the day is in the morning period. There is a sharp increase between 6:00 am to 8:00 am with 100,200 and 400 passengers. Which later on slumped to even less than 200 travellers within the duration of two hours. Between 11:00 am to 2:00 pm, the number plateaus just below 300.
In the afternoon, there was a decline in the number of passengers to almost 100 at 4:00 pm. The evening brings a huge increase from 200 at 5:00 pm to 400 at 6:00 pm. The number of passengers shows a rapid decrease after 6:00 pm to 8:00 pm with a downfall of around 100 passengers. After a small rise at 9:00, the number tails off to just over 100 at 10:00.
Follow Us on Facebook