The pie charts below show the online sales for retail sectors in Australia in 2003 and 2013. Summarise the information by selecting and reporting the main features, and make comparisons where relevant.
 Sample Answer of The Pie Charts Below Show the Online Sales for Retail Sectors in Australia in 2003 and 2013
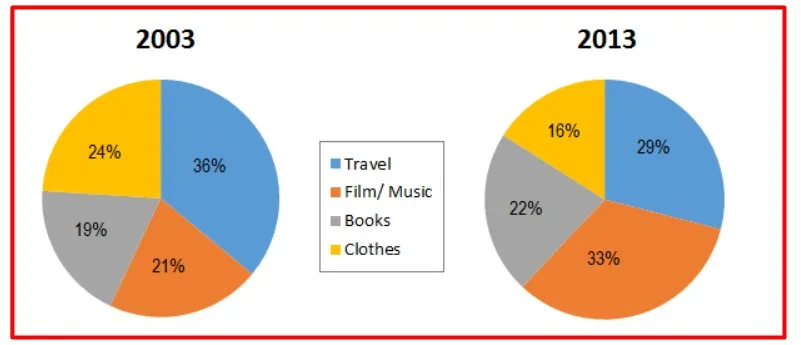
The given pie charts compare the online sales in percentages for travel, film/music, books and clothes in Australia during 2003 and 2013.
Overall, It can be clearly seen from the above pie-charts that the maximum proportion of online sales was shown for travel in 2003 and for film/music in 2013, while least for books and clothes in 2003 and 2013 respectively.
To begin with, In 2003, Although 36% online sales for travel, 19% for books. The proportions of online sales for clothes and film/music were 24% and 21%, respectively.
Furthermore, In 2013, 22% proportion of online sales was shown for books and 29% for travel. 16% was shown by clothes and approximately doubled for film/music (33%).
Follow Us on IELTSFever Facebook