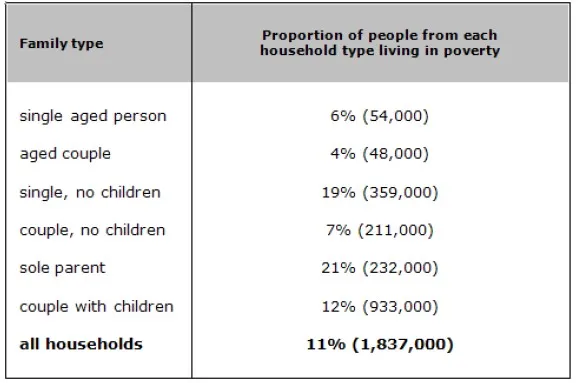
The table below shows the proportion of different categories of families living in poverty in Australia in 1999. Summarise the information by selecting and reporting the main features, and make comparisons where relevant.
The tabular representation gives information about the percentage of UK citizen classes are in famine in the year 1999. Overall, it is clear from the table that almost 11 % of Australians are suffering from poverty.
As per the illustration, approximately 18 lakh people are from the lower section of society. In this, almost 21% are the sole parents, which is the highest ratio in all given sections, which consist of almost 2.3 lakh people. The second-highest poverty (19%) was seen in single parents with no children class which consisted of 3,59,000 people, while a couple with children dwellers were maximum that had nearly 9.3 lakh.
Moreover, the per cent ratio was 12, which was double of a single aged parent. Furthermore, the ratio increased by 1 per cent in couples with no children consisting of over 2 lakh citizens. The lowest proportion and number was seen in the aged couple category, which is 4% and 48000 respectively.
In the end, it can be concluded that almost 2 lakh dwellers are suffering from poverty.
Follow Us on IELTSFever Facebook
Also read: Number of Travellers Using Three Major German Airports Between 2007 and 2012
