We Were Given a Plan for A New Town and Asked to Describe It
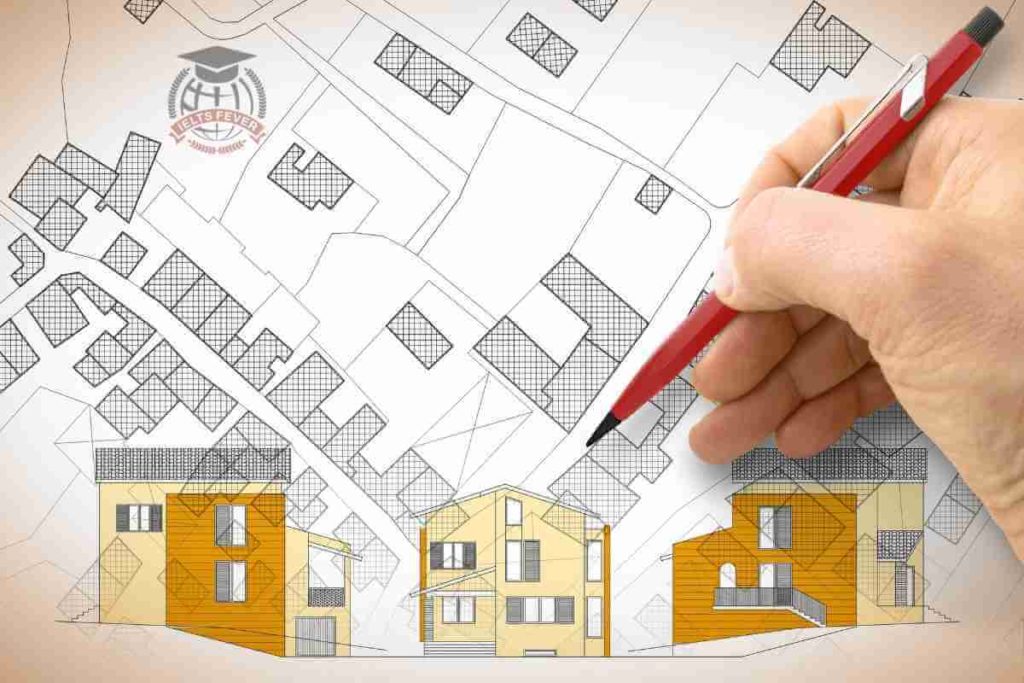
We were given a plan for a new town and asked to describe it. The plan was similar to the one below: Summarize the information by selecting and reporting the main features and making comparisons where relevant. The diagram illustrates the plan for a new town with advanced facilities. Looking at the overall design, it […]
We Were Given a Plan for A New Town and Asked to Describe It Read More »