The bar chart below gives information about the percentage of the population living in urban areas in different parts of the world. Summarise the information by selecting and reporting the main features, and make comparisons where relevant.
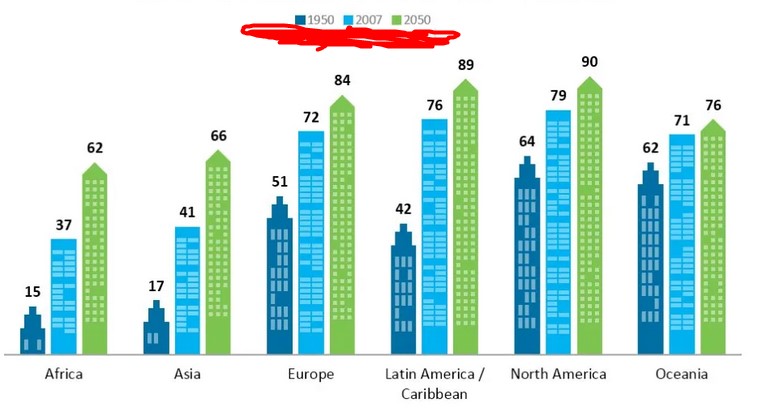
In the above bar chart changes in the percentage of the population in urban areas of different continents like Africa, Asia, Europe, Caribbean, North America and Oceania from the era 1950 to 2007 and 2007 to 2050. The above chart shows the similarities in Continent Africa and Asia according to the growth of urban population in 1950 to 2007 from 15% to 37% in Africa and 17% to 41% in Asia respectively it almost the double of 1950 in 2007 although from 2007 to 2050 the increase in the population around 60% increase in the continent of Africa and Asia.
Whereas the other continents mentioned in the bar chart as Europe, Caribbean, North America and Oceania have fluctuated in the growth rate of population from 1950 to 2007. The Growth rate good increased in the Caribbean as compared to Europe from 1950 to 2007and less increase in 2050 which indicated the people in the Caribbean have more growth rate as compared with Oceania and North America from 1950 to 2007 and similarities in the growth rate of Europe, Caribbean, North America and Oceania from 2007 to 2050 which is almost 10%. The growth rate is also closely connected to the Caribbean and North America in 2050, whereas a minor increase is around 5% in Oceania.
Follow Us on IELTSFever Facebook
Also read: Number of Visitors to Four London Museums