The chart below shows the global sales (in billions of dollars) of different kinds of digital games from 2000 to 2006. Summarise the information by selecting and reporting the main features,
and make comparisons where relevant. Write at least 150 words.
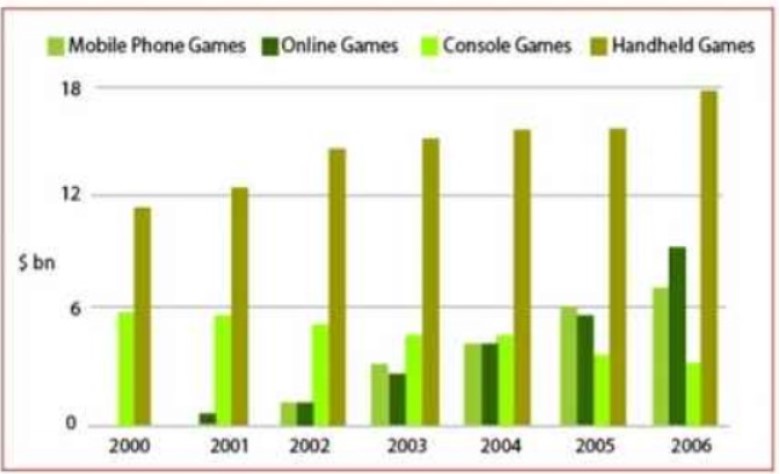
The graph chart illustrates the global sales of different types of digital games between 2000 and 2006. The data are depicted in billions of dollars. Overall, mobile phones, handheld and online games show highest sales in the year 2006 except the console games.
To begin with, online games sales increased steadily from the year 2001 to 2006 with depicts highest sales around 8 billion dollars in 2006. On the other hand, console games selling are fluctuating in the period of six years. Mobile phones and online games show no sales in the year 2000, while mobile phone games still continued to have zero sales in 2001.
All four games together sales begin in last four periods. Console games show almost the same sales of around 5 billion dollars in the first two years of time. Similarly, handheld games show steady sales in the years 2004 and 2005 with approximately 15 billion dollars.
Overall, handheld games are leading in global sales in the period of six years, with the highest sales of 17 billion dollars in 2006.
Follow Us on IELTSFever Facebook
Also read: The graph below shows the amount of UK investments in clean energy from 2008 to 2015