The graph below gives information about the number of Catholics residing in different nations, during 2010-2013. Summarise the information by selecting and reporting the main features, and make comparisons where relevant.
The graph below gives information about the number of Catholics residing in different nations,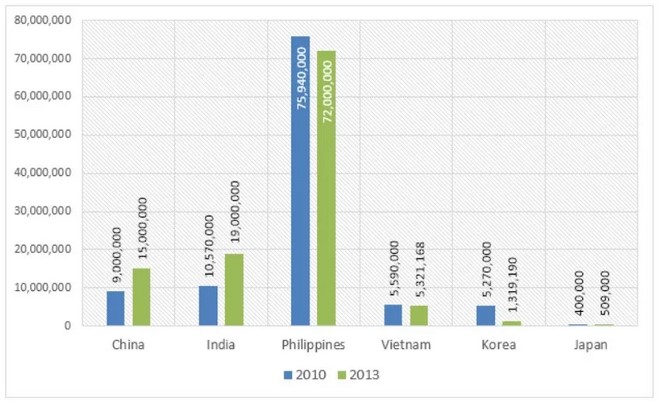
The graph provides data on the catholic population in different countries between the years 2010 to 2013.
Overall, the Philippines recorded the highest numbers of Catholics for both year periods, whereas Japanese Catholics were the least throughout the period. There were fluctuations in all countries as some experienced population growth while others suffered a reduction in numbers.
In the year 2010, the Catholic populace of the Philippines, India and China were high with numbers 75,940,000, 10,570,000 and 9,000,000, respectively. Vietnam and Korea had similar figures, which were about half of that of India. The country with the smallest population size of Catholics was Japan, which recorded 400,000 people.
2013’s statistics bore a resemblance to that of 2010. Although the previous year had a larger population size, the chart was still topped by Filipino Catholics with 72,000,000. Indian Catholics were 19,000,000, a close to 100% increase, and lastly, Chinese Catholics were 15,000,000, which was an over 50% increment. The smallest population of Catholics was from Vietnam (5,321,168), Korea (1,319,190) and Japan (509,000), which had experienced a population growth of about 25%.
Follow Us on IELTSFever Facebook