Describe a Time When You Saw a Wild Animal
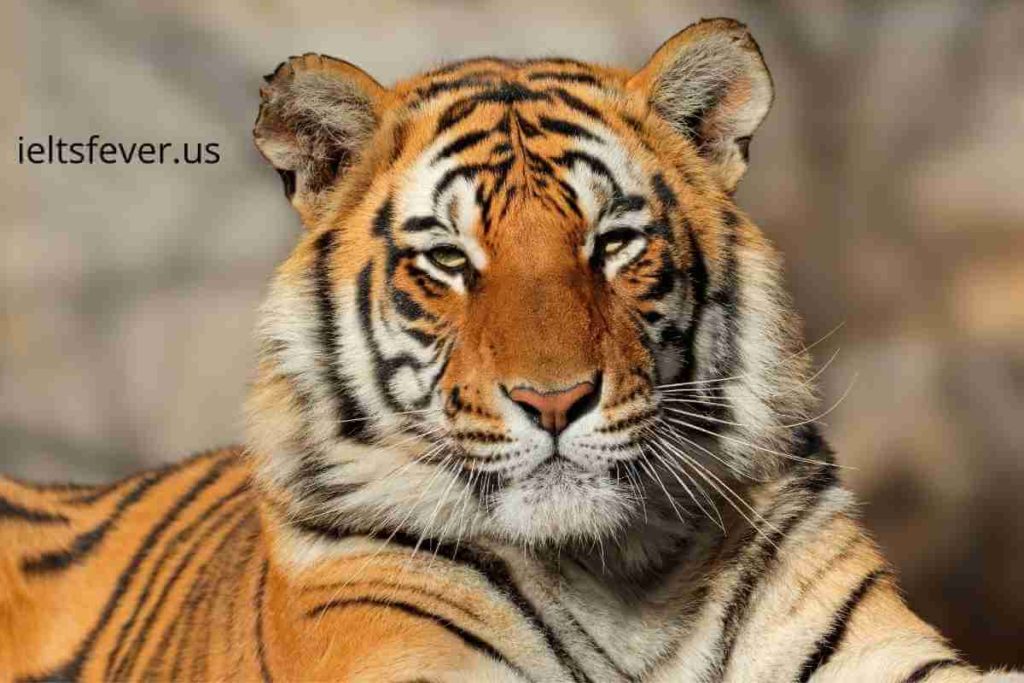
Describe a Time When You Saw a Wild Animal You should say What it looked like? Where did you see it? What does it like to eat or do? Why did you like it? Sample Answer of Describe a Time When You Saw a Wild Animal India is a diverse country, a plethora of animals […]
Describe a Time When You Saw a Wild Animal Read More »